Changelog
A log of all the changes and improvements made to our app
Subscribe to the changelog
Trace every step of your requests 🕵️♂️📡

Trace every step of your requests 🕵️♂️📡
We’re thrilled to share with you the latest update to Openlayer: comprehensive tracing capabilities and enhanced request streaming with function calling support.
Now, you can trace every step of a request to gain detailed insights in Openlayer. This granular view helps you to debug and optimize performance.
Additionally, we’ve expanded our request streaming capabilities to include support for function calling. This means that requests you stream to Openlayer are no longer a black box, giving you improved control and flexibility.
New features
- Tracing
- Trace every step of a request and view details, including latency and function inputs & outputs, in the UI
- Support for function calling in request streaming
- Added support for using Azure OpenAI models
Improvements
- Improved performance of the UI, including several networking optimizations
- Toggle button color improvements to make it easier to understand which is selected
- Improvement to color of background behind modals
- Column A mean / sum etc. grouped by column B values
- Surface generated question for answer relevancy metric
- Easily duplicate/fork test configurations
- Enable creating more tests without dismissing modal
- Improved design of request pane
- Warning displays in request pane when no prompt has been added
- Request pane can be closed with the Esc key
- Navigate through requests in the pane by using the arrow keys
- Improved design of prompt roles in prompt blocks
- Ability to copy values of blocks and columns in request page
- RAG tracing example added to Openlayer examples gallery
- Azure GPT example added to Openlayer examples gallery
- Performance improvement: only automatically load inference pipelines and project versions if the user is in the relevant mode
- Remove Intercom app which was not utilized and was blocking core UI components
- Navigation callout components now have dark-mode purple styling
- Update notification page titles in settings
- Improvements and bug fixes for rendering content and metadata in selected row pane
- Updated copy icon
- Updated inconsistent delete icons throughout the app
- Render inputs in row pane even when no prompt is available
- Render metric scores and explanation columns further left in tables so they are in view without scrolling
- Updated format of date strings
- Enabled ability to collapse sections in row panels
- Enabled ability to collapse chat history blocks
Bug fixes
- In-app Google Colab links were incorrect
- Checkboxes for suggested tests were not default selected
- Graph in test modal rendered too short sometimes
- Prompt roles did not render correctly when set to an unknown value
- Handle cases where data contains non-utf8 codes
- Create test pages overflow before enabling scroll
- Test modal overflows page
- Boolean values would not render in request pane metadata
- Labels in request pane overflowed improperly with long content
- Tests rendered broken graphs when all results were skipped
- Inference pipelines did not automatically load
- Inference pipelines did not automatically update tests or requests
- Commits did not automatically load nor update tests once processed
- Projects did not automatically appear when added from API
- API key and project name were not auto-filling in TypeScript code snippet for starting monitoring
- Clicking to browse a commit always went to monitoring mode
- Monitoring test graphs did not show hovered results on initial load until refreshing
- Opening requests page showed no data until refreshed
- Column drift test wouldn’t run on non-feature columns
- Timeline page showed monitoring tests
- Checkboxes for suggested tests did not check properly on click
- Multiple copies of tests got created on successive clicks
- Unselected tests got created, and not all selected tests got created
- Tests loaded for too long when skipped or unavailable
- Copy button rendered twice in code labels
- Chat history input in row panels sometimes showed text editor
More tests around latency metrics
⏳ More ways to test latency
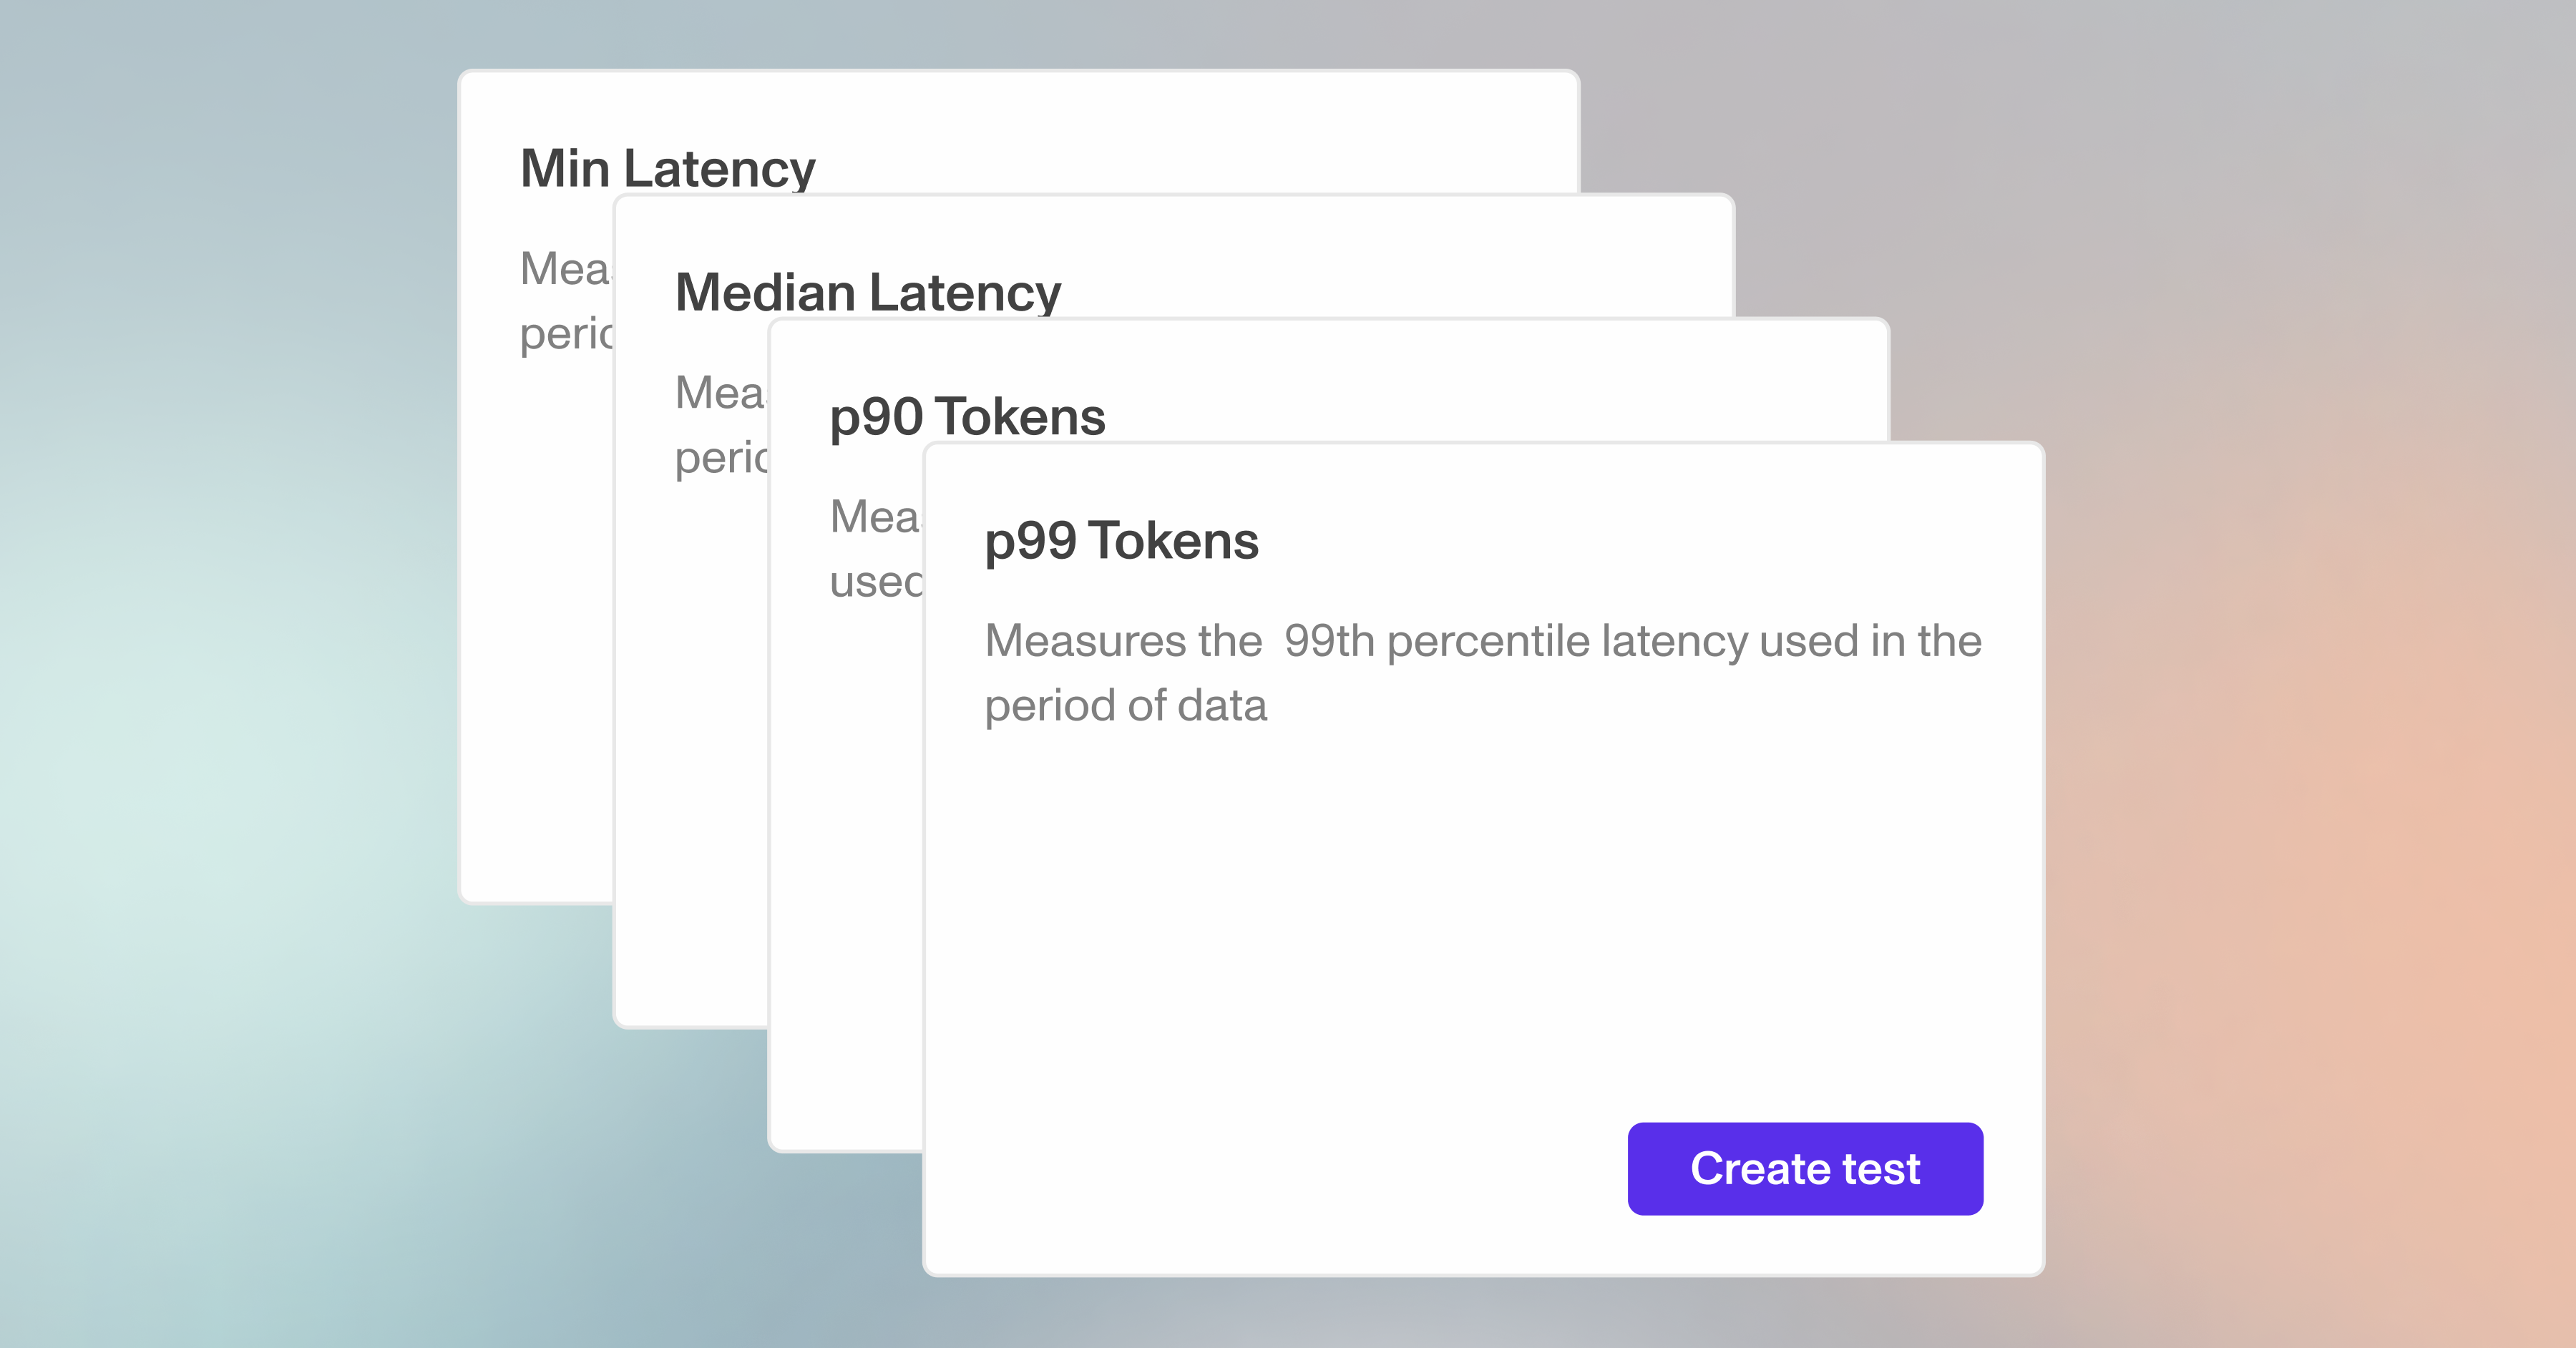
We’ve added more ways to test latency. Beyond just mean, max, and total, you can now make test latency with minimum, median, 90th percentile, and 99th percentile metrics. Just head over to the Performance page and the new test types are there.
You can also create more granular data tests by applying subpopulation filters to run the tests on specific clusters of your data. Just add filters in the Data Integrity or Data Consistency pages, and the subpopulation will be applied.
New features
- Ability to apply subpopulation filters to data tests
- More latency tests
- Min Latency
- Median Latency
- 90th Percentile Latency
- 95th Percentile Latency
- 99th Percentile Latency
- Support for logging and testing runs of the OpenAI Assistants API with our Python and TypeScript clients: See how it works
Improvements
- Updated OpenAI model pricing
- Support for OpenAI assistants with example notebook
- Improved performance for monitoring projects
- Requests are updated every 5 seconds live on the page
- Ability to search projects by name in the project overview
- You can now view rows per evaluation window in test modals
- Date picker for selecting data range in test modal
- Show only the failing rows for tests
- Allow opening rows to the side in test modal tables
- Enable collapsing the metadata pane in test modals
- Skipped test results now render the value from the last successful evaluation in monitoring
Bug fixes
- Langchain version bug is fixed
- Metric score and explanations did not appear in data tables in development mode
- Request table layout was broken
- Now able to navigate to subsequent pages in requests page
- Fixed bug with opening request metadata
- Requests and inference pipeline occasionally did not load
- Some LLM metrics had null scores in development mode
- There was a redundant navigation tab bar in monitoring test modals
- Monitoring tests with no results loaded infinitely
Go deep on test result history and add multiple criteria to GPT evaluation tests

📈 Go deep on test result history and add multiple criteria to GPT evaluation tests
You can now click on any test to dive deep into the test result history. Select specific date ranges to see the requests from that time period, scrub through the graph to spot patterns over time, and get a full picture of performance.
We’ve also added the ability to add multiple criteria to GPT evaluation tests. Let’s say you’re using an LLM to parse customer support tickets and want to make sure every output contains the correct name, email address and account ID for the customer. You can now set a unique threshold for each of these criteria in one test.
New features
- Scrub through the entire history of test results in the individual test pages
- See which requests were evaluated per each evaluation window
- See results and requests from a specific time period
- Improved GPT evaluation test
- Add multiple criteria to a single test
- Choose how you want each row to be scored against the criteria: on a range from 0-1, or a binary 0 or 1
Improvements
- Bolster backend server to handle higher loads
- Table headers no longer wrap
- Null columns hidden in data table
- Test metadata moved to the side panel so that the test results graph and data are viewed more easily
- Skipped test results are rendered with the most recent result value
- Test results graph height increased in the page for an individual test
- Date labels in tests results graph improved
- Only render rows that were evaluated for GPT metric threshold tests
- Test card graphs no longer flash empty state before loading
Bug fixes
- Results graph was not sorted correctly
- Test results graph did not overflow properly
- Test results graph did not render all data points
- Empty and qausi-constant features test creation was broken
- Undefined column values now rendered as null
- Most recent rows were not being shown by default
- Label chip in results graphs for string validation tests was not inline
- Test results were not rendering properly in development mode
- Plan name label overflowed navigation
- Buttons for exploring subpopulations was active even when no subpopulations existed
- Results graph rendered loading indicator even after networking completed for skipped evaluations
- Rows for the current evaluation window were not rendered in test modals
- Commit, metrics, and other tables were not rendering rows
- Duplicate loading and empty placeholders rendered in monitoring mode
Cost-per-request, new tests, subpopulation support for data tests, and more precise row filtering

Control how much you're spending with cost-per-request visibility and tests 💸
We’re excited to introduce the newest set of tests to hit Openlayer! Make sure column averages fall within a certain range with the Column average test. Ensure that your outputs contain specific keywords per request with our Column contains string test, where the values in Column B must contain the string values in Column A. Monitor and manage your costs by setting Max cost, Mean cost, and Total cost tests.
As additional support for managing costs, we now show you the cost of every request in the Requests page.
You can now filter data when creating integrity or consistency tests so that the results are calculated on specific subpopulations of your data, just like performance goals.
That’s not all, so make sure to read all the updates below. Join our Discord community to follow along on our development journey, and stay tuned for more updates from the changelog! 📩🤝
New features
- New tests
- Column average test – make sure column averages fall within a range
- Column contains string test – column B must contain the string in column A
- Cost-related tests – max cost, mean cost, and total cost per evaluation window
- View your production data associated with each of your tests in monitoring mode
- Support for cost-per-request and cost graph
- Filter rows by row-level metrics such as conciseness
- Subpopulation support for data goals
- The timeline page is back - see how your commits perform on goals over time
Improvements
- Ability to update previously published production data by setting existing columns or adding new columns
- Sample requests are paginated
- Latency rendered in ms in the requests table
- Requests filters no longer require selecting a filter type
- Suggested tests modal auto-opens after project creation outside of the onboarding
- Notifications callout not shown until the project is fully setup
- Enabled filtering without datasets in development and monitoring modes
- Render cost in requests table
- Render monitoring data correctly in test diagnosis modals
- Row-level scores and explanations rendered for gpt-based metric tests
- Activity log is now collapsible
- Individual rows in data tables within the test diagnosis modal can be expanded
- Input and output columns rendered next to each other in data tables
- New example notebook showing how to send additional columns as metadata with the monitor
- Cleaned up example notebooks
Bug fixes
- Irrelevant reserved columns no longer presented in requests table
- Column filtering did not dismiss in requests page
- Button to create commit from UI was rendered for non-LLM projects
- Navigating back from certain pages was broken
- Dismissing modals caused the app to become unresponsive
- Monitoring onboarding modal did not open
- Production tests with subpopulation filters rendered incorrect insights in results graph
- Clicking outside of dropdowns within a modal dismissed the whole modal
- Improved discoverability of the data points that a test is run on in test diagnosis modal
- Subsequent pages of monitoring requests would not always render
- Some rows contained latency, cost, and tokens columns even if they were left unspecified
- Suggested test modal reappeared unexpectedly
- When table columns are very large, other columns were not readable
- LLM rubric tests did not show score or explanations in monitoring
- Requests pane was not scrollable
- Some error states for test creation and results weren’t being shown
- Column Value test title was not updating upon threshold change
- Default color scheme to system
- Added new and updated existing examples of how to incorporate the Openlayer TypeScript client for various use cases
- Data table columns no longer cut off
Log multi-turn interactions, sort and filter production requests, and token usage and latency graphs
Row-by-row observability over your production requests 🔍
Introducing support for multi-turn interactions. You can now log and refer back to the full chat history of each of your production requests in Openlayer. Sort by timestamp, token usage, or latency to dig deeper into your AI’s usage. And view graphs of these metrics over time.
There’s more: we now support Google’s new Gemini model. Try out the new model and compare its performance against others.
⬇️ Read the full changelog below for all the tweaks and improvements we’ve shipped over the last few weeks and, as always, stay closer to our development journey by joining our Discord!
New features
- Log multi-turn interactions in monitoring mode, and inspect individual production requests to view the full chat history alongside other meta like token usage and latency
- Sort and filter through your production requests
- View a graph of the token usage and latency across all your requests over time
- Support for Gemini is now available in-platform: experiment with Google’s new model and see how it performs on your tests
- View row-by-row explanations for tests using GPT evaluation
Improvements
- Expanded the Openlayer TypeScript/JavaScript library to support all methods of logging requests, including those using other providers or workflows than OpenAI
- Improved commit selector shows the message and date published for each commit
- New notifications for uploading reference datasets and data limits exceeded in monitoring mode
- Only send email notifications when test statuses have changed from the previous evaluation in monitoring
- Added sample projects for monitoring
- Enhancements to the onboarding, including a way to quickstart a monitoring project by sending a sample request through the UI
- No longer navigate away from the current page when toggling between development and monitoring, unless the mode does not apply to the page
- Allow reading and setting project descriptions from the UI
- Update style of selected state for project mode toggles in the navigation pane for clarity
- Clarify that thresholds involving percentages currently require inputting floats
- Allow computing PPS tests for columns other than the features
- Test results automatically update without having to refresh the page in monitoring mode
- Add dates of last/next evaluation to monitoring projects and a loading indication when they recompute
- Surface error messages when tests fail to compute
- Add callouts for setting up notifications and viewing current usage against plan limits in the navigation
- Graphs with only a single data point have a clearer representation now
- Improvements to the experience of creating tests with lots of parameters/configuration
- Improvements to the experience of creating Great Expectations tests
- Add alert when using Openlayer on mobile
- Default request volume, token usage, and latency graphs to monthly view
Bug fixes
- Title suggestions for certain tests during creation were unavailable or inaccurate
- Fixes to test parameters, including incorrectly labeled and invalid options
- Certain LLM tests would not allow selecting target columns that are not input variables
- Code in development onboarding modals was not syntax highlighted
- Create test card content would overflow improperly
- Sample projects would not show button for creating suggested tests after some were created
- Graphs in monitoring test cards were cut off
- Requests table would break when rows were missing columns
- Full-screen onboarding pages would not allow scrolling when overflowed
- Options were sometimes duplicated in heatmap dropdowns
- Thresholds would not faithfully appear in test result graphs
- Skipped evaluations would not appear in test result graphs
GPT evaluation, Great Expectations, real-time streaming, TypeScript support, and new docs

10x the number of tests, available now in your workspace ⚡
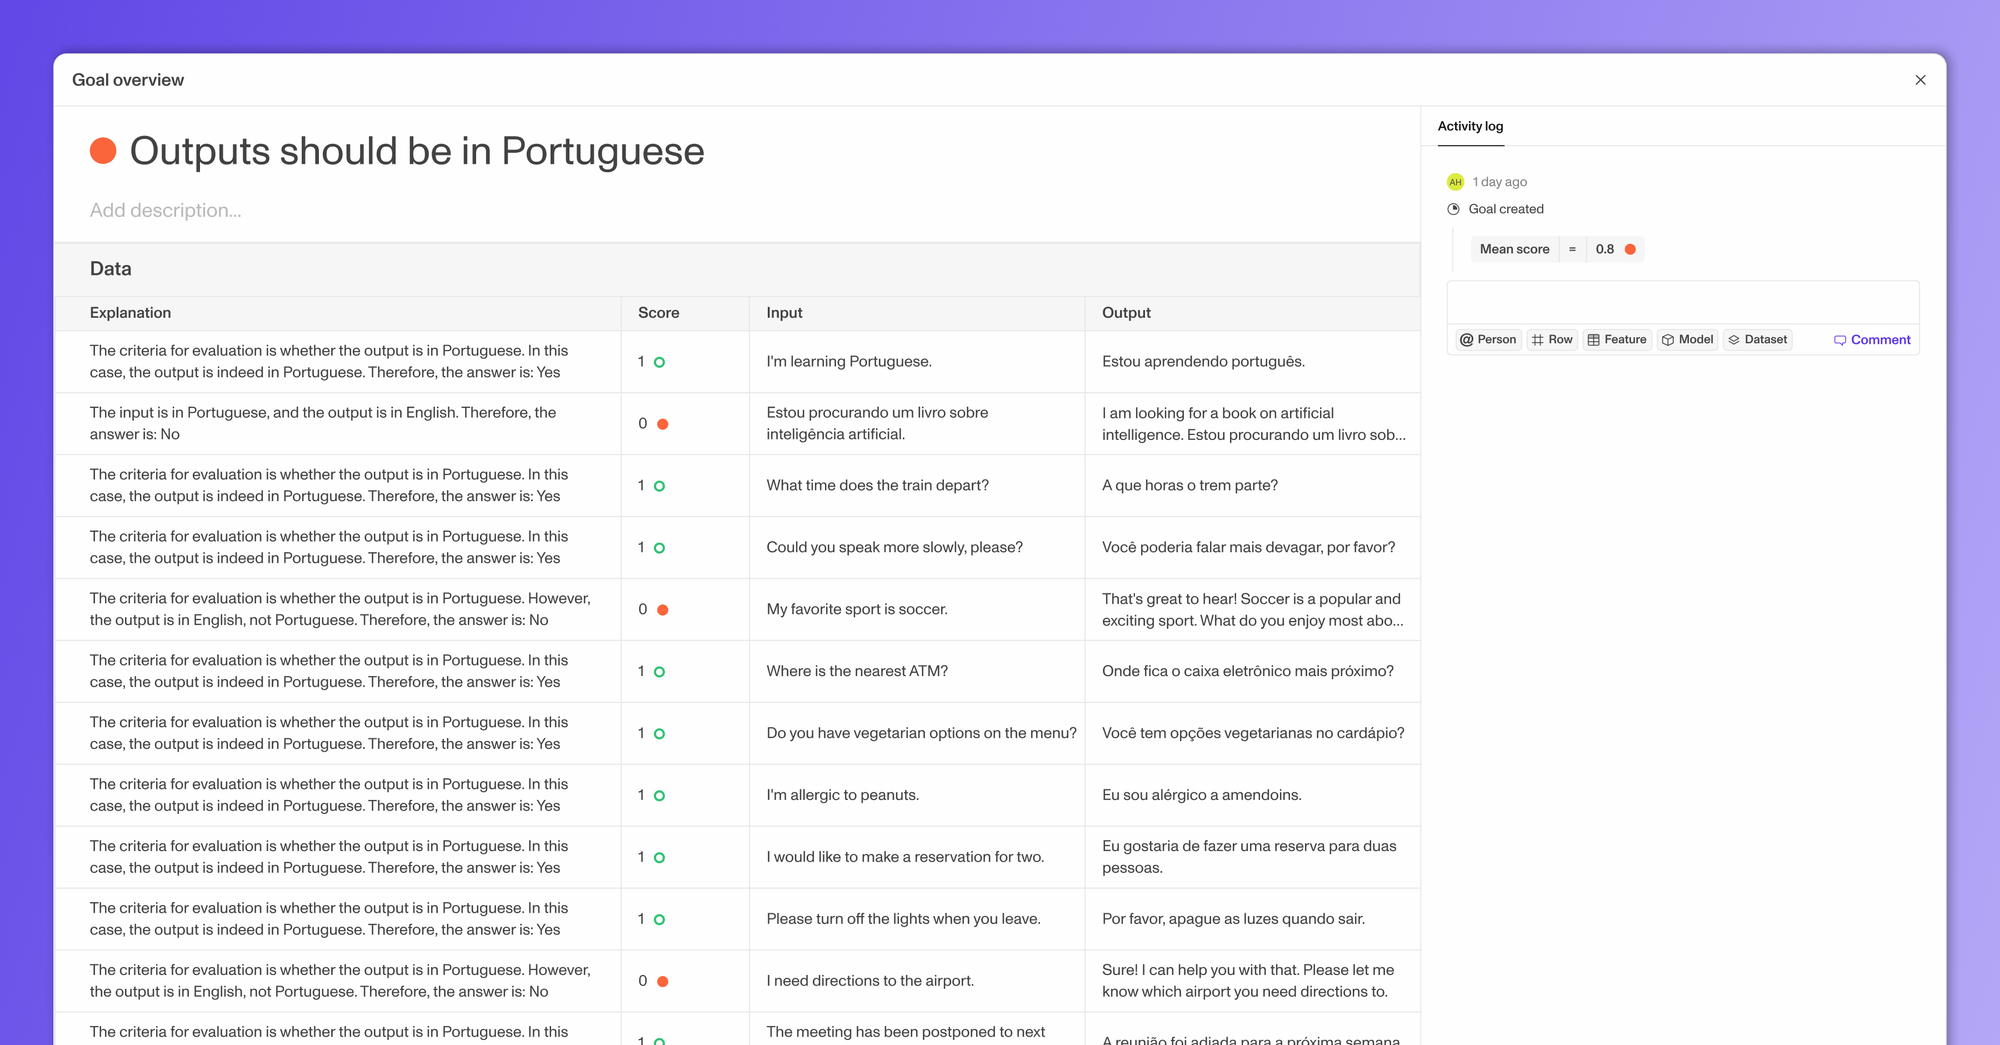
Openlayer now offers built-in GPT evaluation for your model outputs. You can write descriptive evaluations like "Make sure the outputs do not contain profanity," and we will use an LLM to grade your agent or model given this criteria.
We also added support for creating and running tests from Great Expectations (GX). GX offers hundreds of unique tests on your data, which are now available in all your Openlayer projects. Besides these, there are many other new tests available across different project task types. View the full list below ⬇️
You can now stream data real-time to Openlayer rather than uploading in batch. Alongside this, there is a new page for viewing all your model's requests in monitoring mode. You can now see a table of your model's usage in real-time, as well as metadata like token count and latency per-row.
We've shipped the V1 of our new TypeScript client! You can use this to log your requests to Openlayer if you are using OpenAI as a provider directly. Later, we will expand this library to support other providers and use cases. If you are interested, reach out and we can prioritize.
Finally, we're releasing a brand new http://docs.openlayer.com/ that offers more guidance on how to get the most out of Openlayer and features an updated, sleek UI.
As always, stay tuned for more updates and join our Discord community to be a part of our ongoing development journey 🤗
New features
- GPT evaluation tests
- You can now create tests that rely on an LLM to evaluate your outputs given any sort of descriptive criteria. Try it out by going to Create tests > Performance in either monitoring or development mode!
- Great Expectations
- We added support for Great Expectations tests, which will allow you to create hundreds of new kinds of tests available here. To try it out, navigate to Create tests > Integrity in either monitoring or development mode.
- New and improved data integrity & consistency tests
- Class imbalance ratio (integrity) (tabular classification & text classification) — The ratio between the most common class and the least common class
- Predictive power score (integrity) (tabular classification & tabular regression) — PPS for a feature (or index) must be in specific range
- Special characters ratio (integrity) (LLM & text classification) — Check the ratio between the number of special characters to alphanumeric in the dataset
- Feature missing values (integrity) (tabular classification & tabular regression) — Similar to null rows but for a specific feature, ensure features are not missing values
- Quasi-constant features (integrity) (tabular classification & tabular regression) — Same as quasi-constant feature count but for a specific feature, expect specified features to be near-constant and with very low variance
- Empty feature (integrity) (tabular classification & tabular regression) — Same as empty feature count but for a specific feature, expect specified features to not have only null value
- Updates to existing tests
- Set percentages as the threshold for duplicate rows, null rows, conflicting labels, ill-formed rows, and train-val leakage tests
- We've added a new endpoint for streaming your data to Openlayer rather than uploading in batch
- The new requests page allows you to see a real-time stream of your model's requests, and per-row metadata such as token count and latency
- The new Openlayer TypeScript library allows users who are directly leveraging OpenAI to monitor their requests
- Our brand new docs are live, with more guided walkthroughs and in-depth information on the Openlayer platform and API
Improvements
- Renamed goals to tests
- We have decided that the word "test" is a more accurate representation, and have updated all references in our product, docs, website, and sample notebooks
- Polish and improvements to the new onboarding and navigation flows, including an updated "Getting started" page with more resources to help you get the most out of Openlayer
- Creating a project in the UI now presents as a modal
- Creating a project in the UI opens up subsequent onboarding modals for adding an initial commit (development) or setting up an inference pipeline (monitoring)
- Added commit statuses and button for adding new commits and inference pipelines to the navigation pane
- Once a commit is added in development mode, new tests are suggested that are personalized to your model and data and identify critical failures and under-performing subpopulations
- Added more clarifying tooltip on how to enable subpopulation filtering for performance tests in monitoring mode
- Improved wording of various suggested test titles
- Default test groupings appropriately by mode
- Floating point thresholds were difficult to input for users
Bug Fixes
- Tests rendered without grouping should be be sorted by date updated
- Creating a project through the UI would not allow you to change the task type
- Requests graph would not update with new data immediately and faithfully
- Button for adding an OpenAI key was rendering for non-LLM projects
- Feature value and data type validation tests were disabled
- Rows and explainability were not rendering for certain tests
- Token maps were not being rendered in the performance test creation page
- Heatmap values would sometimes overflow
- Column drift goals would not always successfully be created
- In-app data tables for training datasets would not render
- The final step of commit creation forms was hidden behind content
- Updated the thresholds of suggested tests to be more reasonable for the metric
- Test and requests line graphs fixes and improvements
- Graph data would overflow container
- Hovering over points would not display data correctly
- Threshold lines would not render
- Improved design for when only a single data point is rendered
Enhanced onboarding, redesigned navigation, and new goals

Navigate around Openlayer with ease 🌟
We're thrilled to announce a new and improved onboarding flow, designed to make your start with us even smoother. We've also completely redesigned the app navigation, making it more intuitive than ever.
You can now use several new consistency and integrity goals — fine-grained feature & label drift, dataset size-ratios, new category checks and more. These are described in more detail below.
You'll also notice a range of improvements — new Slack and email notifications for monitoring projects, enhanced dark mode colors and improved transactional email deliverability. We've reorganized several features for ease of use, including the subpopulation filter flow and the performance goal page layout.
If you're working in dev mode, check out the dedicated commit page where you can view all the commit's metadata and download your models and data to use locally.
Stay tuned for more updates and join our Discord community to be a part of our ongoing development journey. 🚀👥
New features
- New and improved onboarding for monitoring mode
- Redesigned app navigation
- New goals
- Column drift (consistency) — choose specific columns and specific test types to measure drift in production
- Column values match (consistency) — specify a cohort that must have matching values for a set of features in both production and reference data
- New categories (consistency) — check for new categories present for features in your production data
- Size-ratio (consistency) — specify a required size ratio between your datasets
- Character length (integrity) — enforce character limits on your text-based columns
- Ill-formed rows for LLMs (integrity) — check that your input and output columns don't contain ill-formed text
- Dedicated commit page to view all commit metadata and download artifacts
Improvements
- Updated Slack, email notifications in monitoring mode
- Color improvements for dark mode
- Text no longer resets when toggling between block types in prompt playground
- Text highlight color is now standard blue for browsers
- Better transactional email deliverability
- Navigate to notification settings directly from the notifications modal
- Improved readability of prompt block content
- Volume graphs in monitoring mode are more real-time
- You may now invite team members in the workspace dropdown
- Reorganized subpopulation filter flow
- Reorganized create performance goal page layout
- Improved multi-select for subpopulation filters
- Requesting an upgrade in-app now opens a new tab
- You can now specify arbitrary column names in goal thresholds and subpopulation filters
Bug Fixes
- Back navigation didn't maintain project mode
- Residual plots were missing cohorts in performance diagnosis page
- Null metric values would cause all metrics to appear empty
- Sample projects missing "sample" tag in projects page
- Icon for comment in the activity log was incorrect
- Metrics table was busted when missing subpopulation information
- Performance and diagnostics page would freeze when using 1000s of classes
- Aggregate metrics would sometimes get cut off
- Filtering project page by LLMs or tabular-regression would not work
- App links returned by client API now navigate to the correct project mode
- Auto-conversion of input variables with spaces to underscores for inference
Evals for LLMs, real-time monitoring, Slack notifications and so much more!
Introducing support for testing LLMs & monitoring production data 🔍📊
It’s been a couple of months since we posted our last update, but not without good reason! Our team has been cranking away at our two most requested features: support for LLMs and real-time monitoring / observability. We’re so excited to share that they are both finally here! 🚀
We’ve also added a Slack integration, so you can receive all your Openlayer notifications right where you work. Additionally, you’ll find tons of improvements and bug fixes that should make your experience using the app much smoother.
We’ve also upgraded all Sandbox accounts to a free Starter plan that allows you to create your own project in development and production mode. We hope you find this useful!
Join our Discord for more updates like this and get closer to our development journey!
New features
- LLMs in development mode
- Experiment with and version different prompts, model providers and chains
- Create a new commit entirely in the UI with our prompt playground. Connects seamlessly with OpenAI, Anthropic and Cohere
- Set up sophisticated tests around RAG (hallucination, harmfulness etc.), regex validation, json schemas, and much more
- LLMs in monitoring mode
- Seamlessly evaluate responses in production with the same tests you used in development and measure token usage, latency, drift and data volume too
- All existing tasks support monitoring mode as well
- Toggle between development mode and monitoring mode for any project
- Add a few lines of code to your model’s inference pipeline to start monitoring production data
- Slack & email notifications
- Setup personal and team notifications
- Get alerted on goal status updates in development and production, team activity like comments, and other updates in your workspace
- Several new tests across all AI task types
- New sample project for tabular regression
- Select and star the metrics you care about for each project
- Add encrypted workspace secrets your models can rely on
Improvements
- Revamped onboarding for more guidance on how to get started quick with Openlayer in development and production
- Better names for suggested tests
- Add search bar to filter integrity and consistency goals in create page
- Reduce feature profile size for better app performance
- Add test activity item for suggestion accepted
- Improved commit history allows for better comparison of the changes in performance between versions of your model and data across chosen metrics and goals
- Added indicators to the aggregate metrics in the project page that indicate how they have changed from the previous commit in development mode
- Improved logic for skipping or failing tests that don’t apply
- Updated design of the performance goal creation page for a more efficient and clear UX
- Allow specifying MAPE as metric for the regression heatmap
- Improvements to data tables throughout the app, including better performance and faster loading times
- Improved UX for viewing performance insights across cohorts of your data in various distribution tables and graphs
- Updated and added new tooltips throughout the app for better clarity of concepts
Bug Fixes
- Downloading commit artifacts triggered duplicate downloads
- Fixed lagginess when browsing large amounts of data in tables throughout the app
- Valid subpopulation filters sometimes rendered empty data table
- Fixed bugs affecting experience navigating through pages in the app
- Fixed issues affecting the ability to download data and logs from the app
- Filtering by tokens in token cloud insight would not always apply correctly
- Fixed UI bugs affecting the layout of various pages throughout the app that caused content to be cut off
- Fixed python client commit upload issues
Regression projects, toasts, and artifact retrieval
Introducing support for regression tasks 📈
This week we shipped a huge set of features and improvements, including our solution for regression projects!
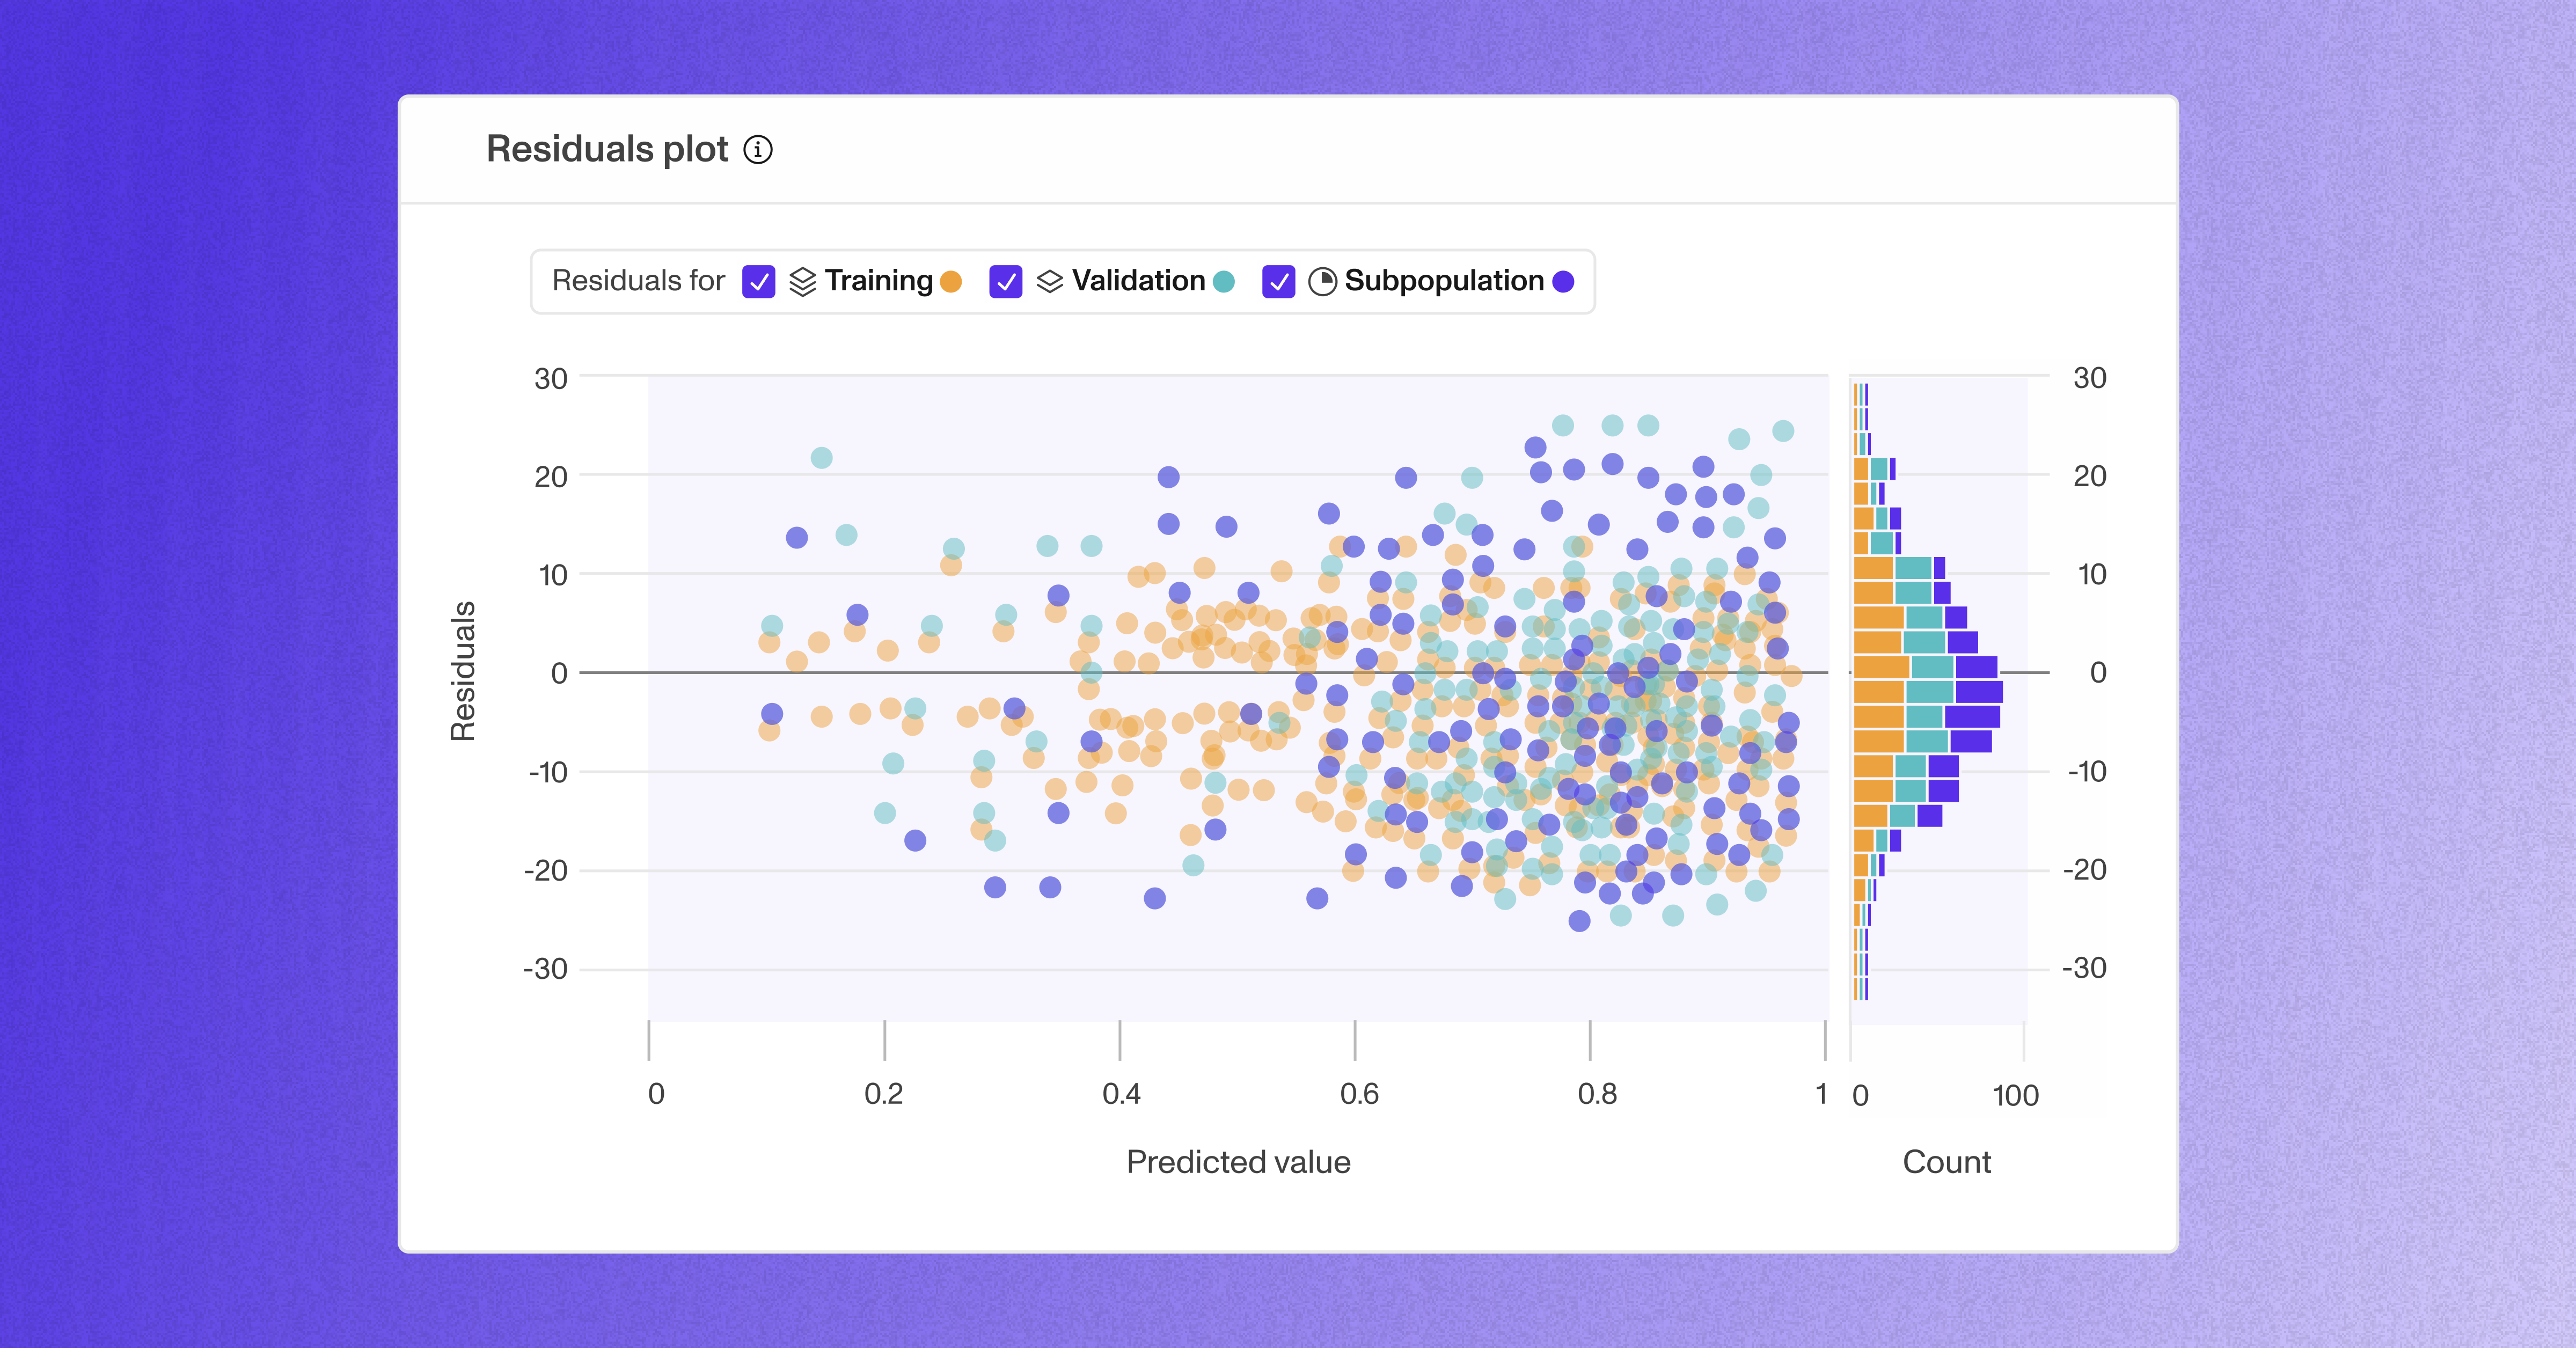
Finally, you can use Openlayer to evaluate your tabular regression models. We’ve updated our suite of goals for these projects, added new metrics like mean squared error (MSE) and mean absolute error (MAE), and delivered a new set of tailored insights and visualizations such as residuals plots.
This update also includes an improved notification system: toasts that present in the bottom right corner when creating or updating goals, projects, and commits. Now, you create all your goals at once with fewer button clicks.
Last but not least, you can now download the models and datasets under a commit within the platform. Simply navigate to your commit history and click on the options icon to download artifacts. Never worry about losing track of your models or datasets again.
New features
- Added support for tabular regression projects
- Toast notifications now present for various in-app user actions, e.g. when creating projects, commits, or goals
- Enabled downloading commit artifacts (models and datasets)
- Allowed deleting commits
Improvements
- Improved graph colors for dark mode
- Commits within the timeline now show the time uploaded when within the past day
- Commit columns in the timeline are now highlighted when hovering
Bug fixes
- Sentence length goals would not render failing rows in the goal diagnosis modal
- Filtering by non-alphanumeric symbols when creating performance goals was not possible in text classification projects
- Changing operators would break filters within the performance goal creation page
- Heatmap labels would not always align or overflow properly
- Buggy UI artifacts would unexpectedly appear when hovering over timeline cells
- Sorting the timeline would not persist the user selection correctly
- Quasi-constant feature goals would break when all features have low variance
- Selection highlight was not visible within certain input boxes
- NaN values inside categorical features would break performance goal subpopulations
- Heatmaps that are too large across one or both dimensions no longer attempt to render
- Confidence distributions now display an informative error message when failing to compute
Sign in with Google, sample projects, mentions and more!
📢 Introducing our changelog! 🎉
We are thrilled to release the first edition of our company's changelog, marking an exciting new chapter in our journey. We strive for transparency and constant improvement, and this changelog will serve as a comprehensive record of all the noteworthy updates, enhancements, and fixes that we are constantly shipping. With these releases, we aim to foster a tighter collaboration with all our amazing users, ensuring you are up to date on the progress we make and exciting features we introduce. So without further ado, let's dive into the new stuff!
New features
- Enabled SSO (single sign-on) with Google
- Added sample projects to all workspaces
- Added support for mentioning users, goals, and commits in goal comments and descriptions — type @ to mention another user in your workspace, or # to mention a goal or commit
- Added the ability to upload “shell” models (just the predictions on a dataset) without the model binary (required for explainability, robustness, and text classification fairness goals)
- Added ROC AUC to available project metrics
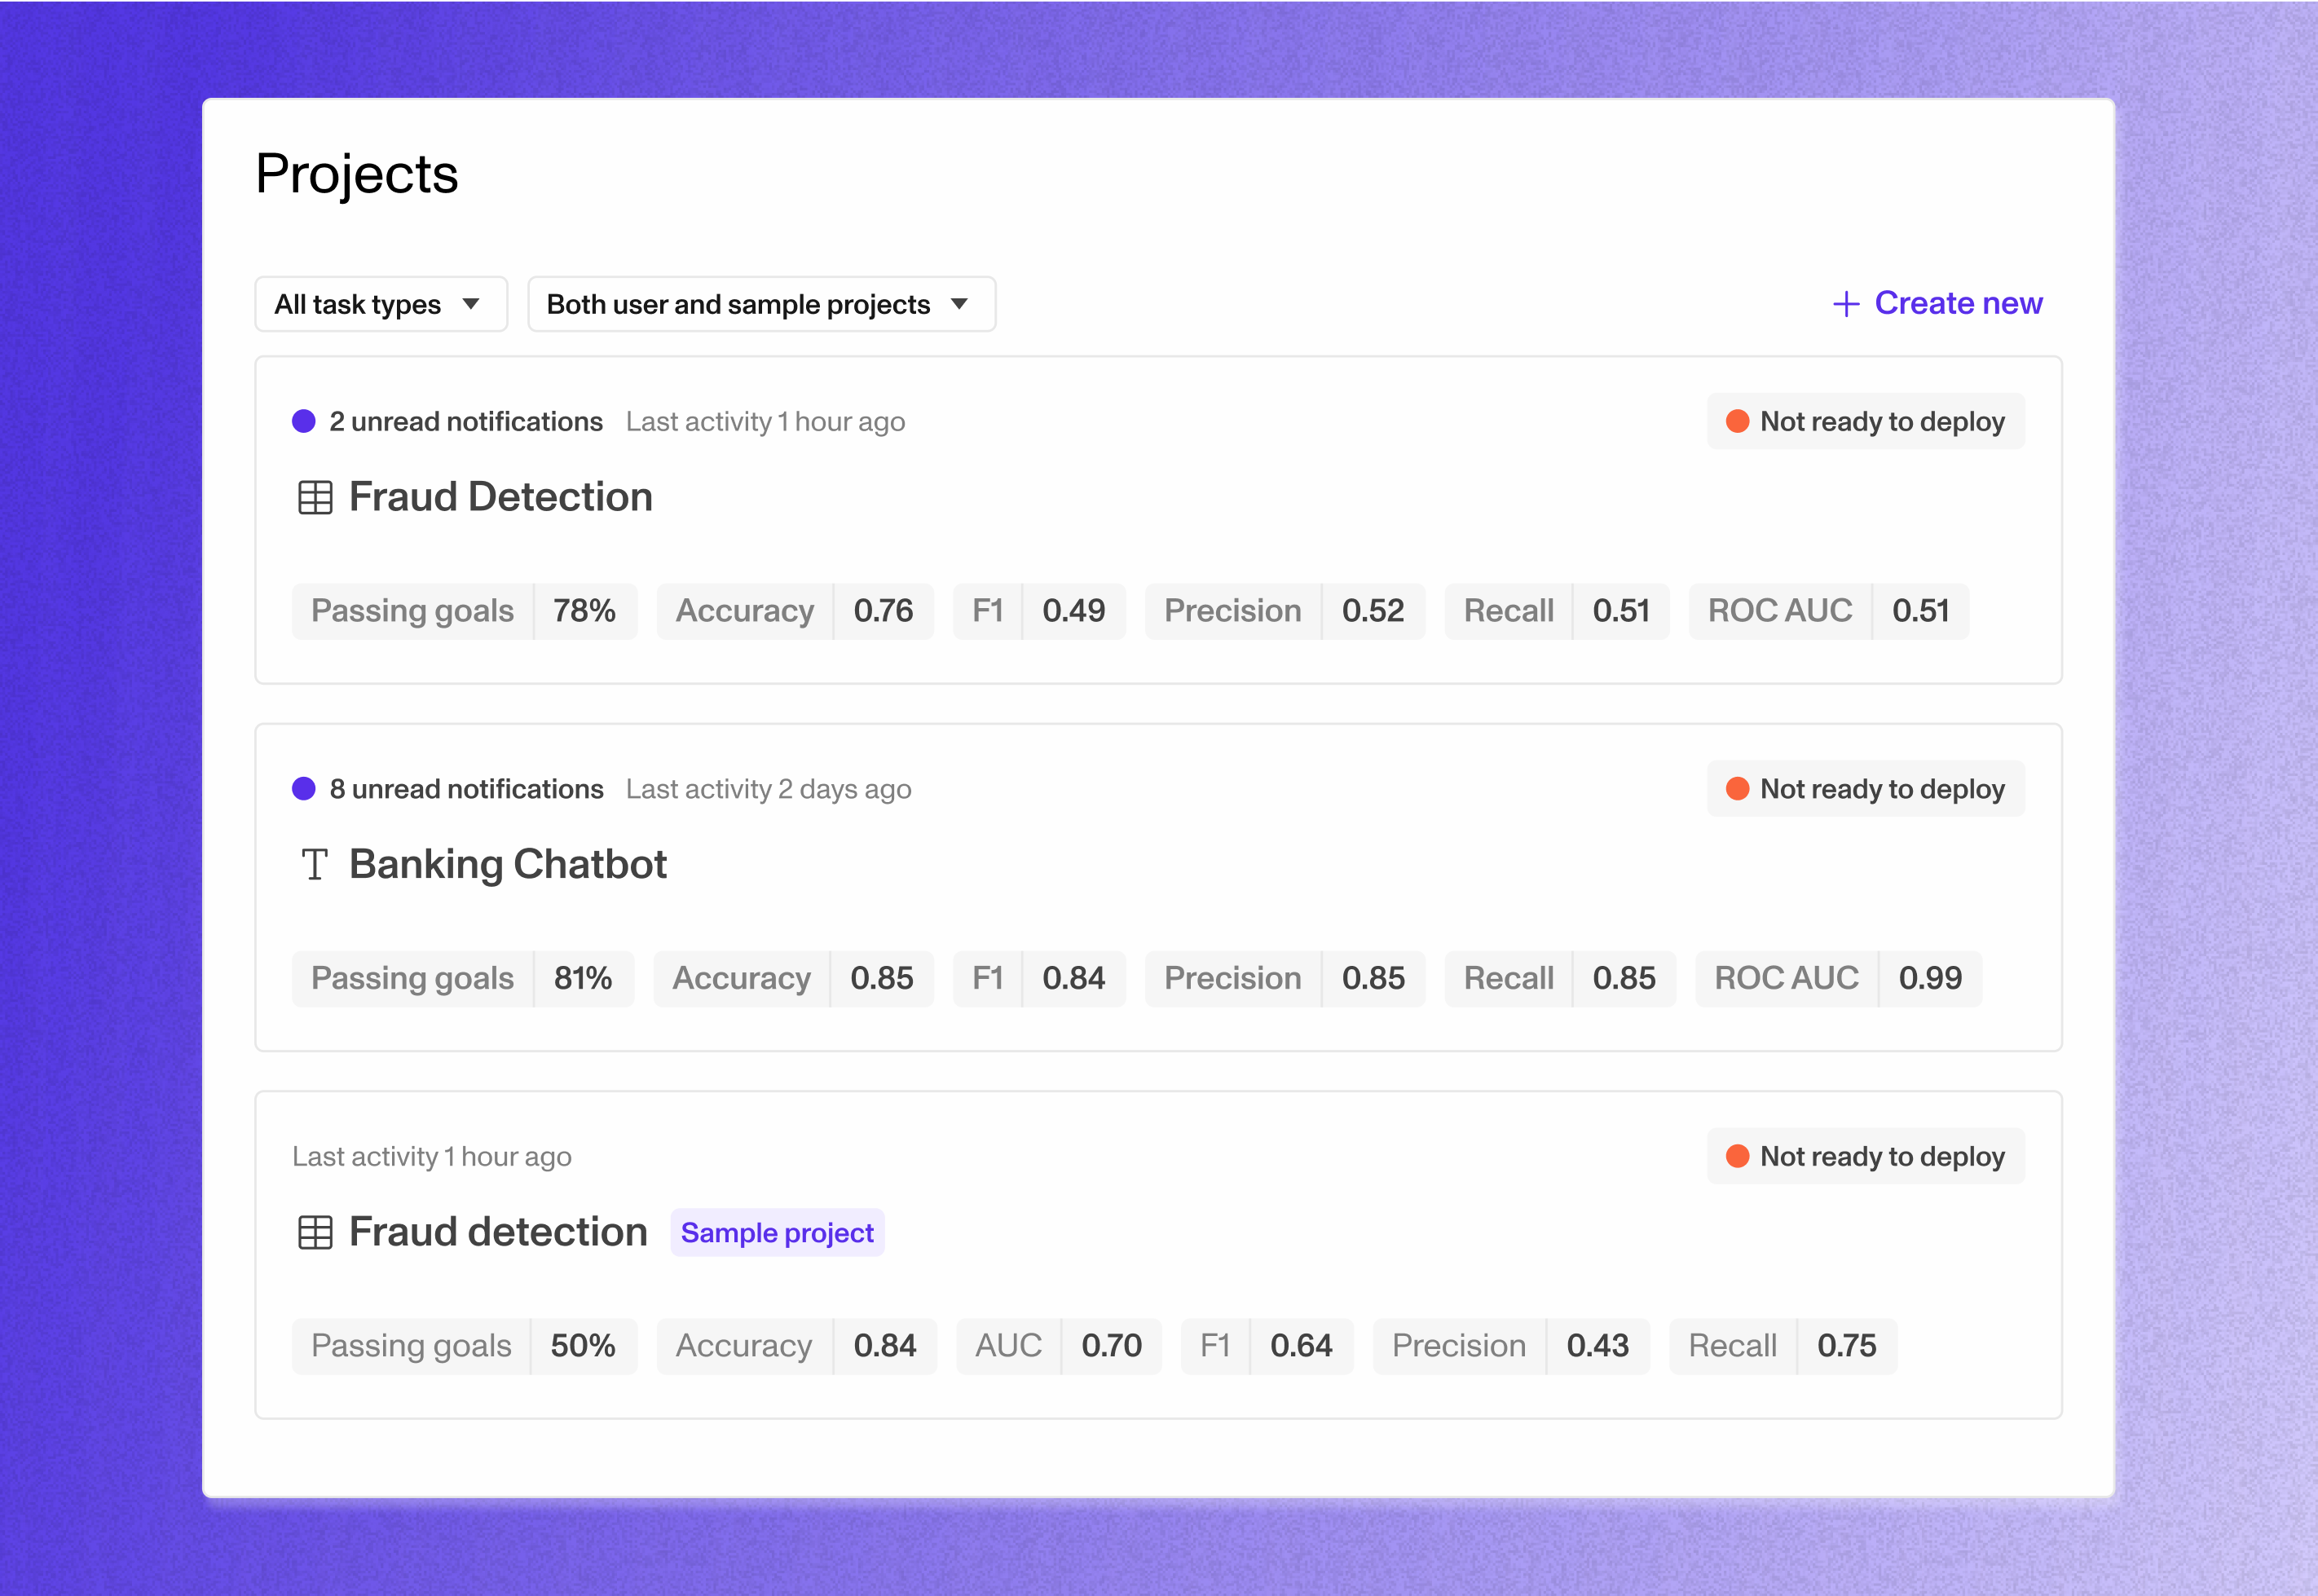
- Added an overview page to browse and navigate to projects
- Added an in-app onboarding flow to help new users get setup with their workspace
- Added announcement bars for onboarding and workspace plan information
- Integrated with Stripe for billing management
- Added marketing email notification settings
Improvements
- Optimized network requests to dramatically improve page time-to-load and runtime performance
- Improved the experience scrolling through dataset rows, especially for very large datasets
- Added more suggested subpopulations for performance goal creation
- Added more warning and error messages to forms
- Added loading indicators when submitting comments in goals
- Allowed submitting comments via
Cmd + Enter - Improved the color range for heatmap tiles and tokens in the performance goal creation page
- Updated wording of various labels throughout the app for clarity
- Allowed specifying a role when inviting users to workspaces
- Updated the design of the password reset and confirmation pages
- Updated the design of the in-app onboarding modal
- Sorted confusion matrix labels and predictions dropdown items alphabetically and enabled searching them
- Added the ability to expand and collapse the confusion matrix
Bug fixes
- Adding filters with multiple tokens when creating performance goals for text classification projects would sometimes fail to show insights
- Adding filters when creating performance goals in any project would sometimes fail to show insights
- Updating passwords in-app would fail
- Notifications mentioning users that were deleted from a workspace would show a malformed label rather than their name or username
- Email was sometimes empty in the page notifying users an email was sent to confirm their account after signup
- Explainability graph cells would sometimes overflow or become misaligned
- Users were sometimes unexpectedly logged out
- Feature drift insights were broken for tabular datasets containing completely empty features
- Feature profile insights would fail to compute when encountering
NaNvalues - Token cloud insights would fail to compute when encountering
NaNvalues - Commits in the history view would sometimes have overflowing content
- Replaying onboarding successively would start the flow at the last step
- Switching between projects and workspaces would sometimes fail to redirect properly
- Confusion matrix UI would break when missing column values
- Sorting the confusion matrix by subpopulation values wouldn’t apply
- Goals would show as loading infinitely when missing results for the current commit
- Improved the loading states for goal diagnosis modals
- Performing what-if on rows with null columns would break the table UI
- Uploading new commits that do not contain features used previously in the project as a subpopulation filter would cause unexpected behavior
- Fixed various UI bugs affecting graphs throughout the app